SMV and Sewing Line Efficiency Calculation, With Examples
How to calculate SMV from a time study, turn it into sewing line efficiency and a daily target, and what a five-point efficiency gap costs per piece in Taka.
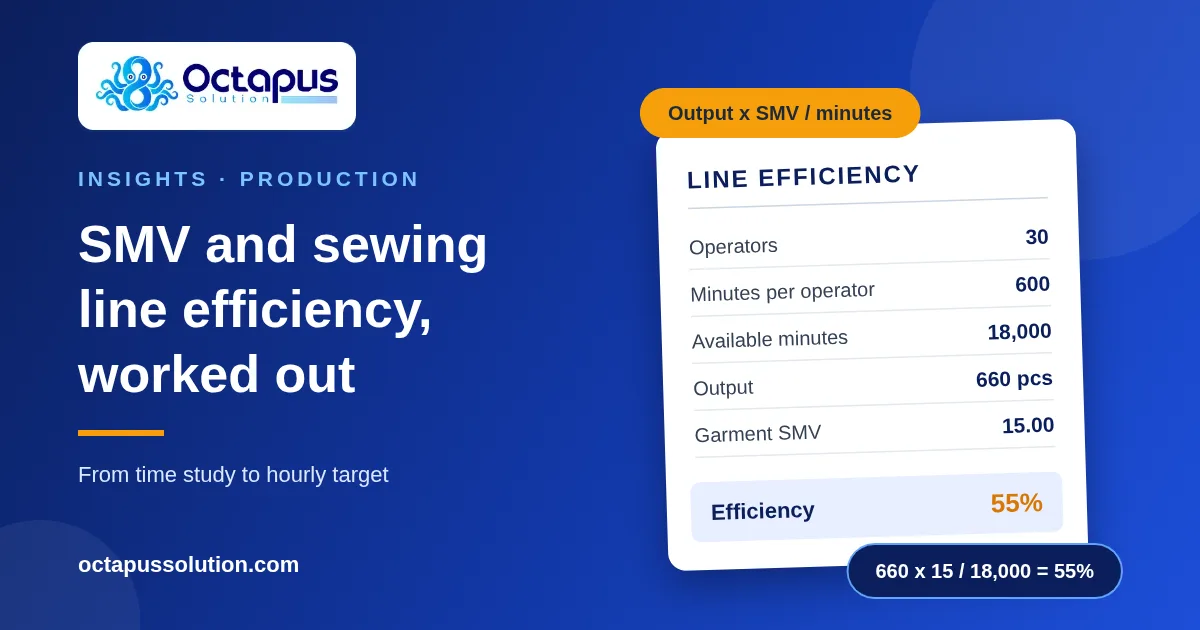
Sewing line efficiency is the standard minutes a line produced divided by the minutes its operators were present, shown as a percentage. The formula is (total output x SMV) / (operators x working minutes) x 100. A line of 30 operators that works 600 minutes and makes 660 pieces of a 15-minute garment has produced 9,900 standard minutes from 18,000 available, so it ran at 55%. The rest of this article explains where the SMV comes from, how to set a target, and why the number is only as good as the hourly data behind it.
What SMV means and how it is built
SMV stands for Standard Minute Value. Some buyers and factories call it SAM, Standard Allowed Minute. It is the time a qualified operator should need to finish one operation, or one whole garment, working at a normal pace with reasonable allowances.
It is built in two steps from a time study.
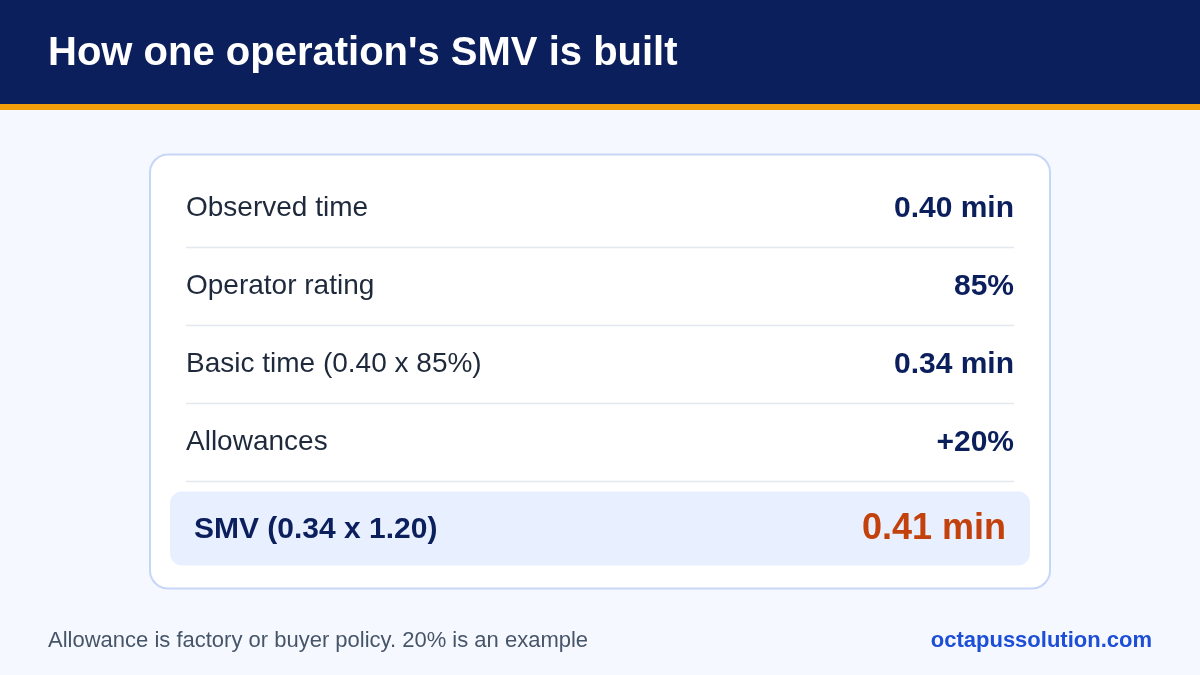
Basic time = observed time x performance rating. The work study officer times the operation over several cycles and takes the average. The rating adjusts for the pace of the operator who was timed. A fast operator is rated above 100%, a slow one below.
SMV = basic time + allowances. Allowances cover personal needs, fatigue, machine delays such as thread breaks and bobbin changes, and bundle handling. They are normally added as a percentage of basic time. The percentage is a factory or buyer policy, often somewhere between 15% and 20%, and it varies by machine type.
Example for one operation, a side seam:
Average observed time: 0.40 minutes
Rating: 85%
Basic time: 0.40 x 0.85 = 0.34 minutes
Allowances at 20%: 0.34 x 0.20 = 0.068 minutes
SMV: 0.34 + 0.068 = 0.408, rounded to 0.41 minutes
The garment SMV is the sum of all operation SMVs on the operation bulletin.
The formulas in one table
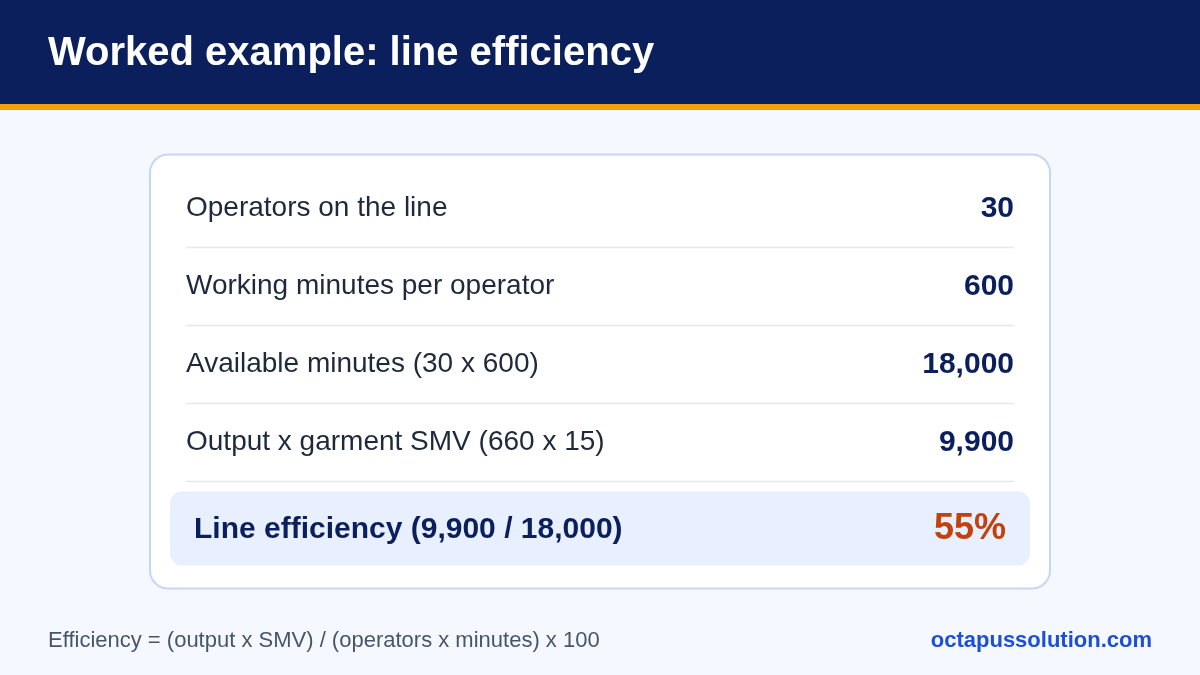
The example column uses one line throughout: 30 operators and helpers, a 10-hour day (600 minutes each), a garment SMV of 15.00 and an actual output of 660 pieces.
Measure | Formula | Example |
|---|---|---|
Basic time | Observed time x rating | 0.40 x 85% = 0.34 min |
SMV | Basic time + allowances | 0.34 + 20% = 0.41 min |
Available minutes | Operators x working minutes | 30 x 600 = 18,000 |
Produced minutes | Total output x SMV | 660 x 15 = 9,900 |
Line efficiency | Produced minutes / available minutes x 100 | 9,900 / 18,000 = 55% |
Daily line target | Available minutes x target efficiency / SMV | 18,000 x 60% / 15 = 720 pcs |
Hourly target | Daily target / working hours | 720 / 10 = 72 pcs |
What the gap costs in Taka
Suppose the line in the example costs the factory Tk 27,000 a day in wages and overtime. The figure is illustrative. Use your own salary sheet.
At 660 pieces (55%), direct labour is Tk 27,000 / 660 = Tk 40.91 per piece.
At the 720-piece target (60%), it is Tk 27,000 / 720 = Tk 37.50 per piece.
Five points of efficiency are worth Tk 3.41 a piece here. This is why SMV and planned efficiency sit at the centre of the CM price. If the costing sheet assumed 60% and the floor ran at 55%, the order lost money on labour before anything else went wrong. We cover that comparison in garment costing versus actual cost.
Count the minutes honestly. Overtime minutes belong in the denominator. A line that reaches its piece target only by working two extra hours has not become more efficient, and those hours are paid at the overtime rate. See how garment overtime is calculated in Bangladesh.
What is a normal efficiency
There is no single official benchmark, and published figures are not measured the same way. Treat the following as a rough guide only.
Factory case studies and industry commentary on Bangladesh often report lines running somewhere between the high 30s and the mid 50s per cent.
Well-managed lines on long-running basic styles are commonly reported at 60% to 70% or more.
New styles start low and climb over the first days. A changeover week will drag the monthly average down.
Factories count helpers and set SMVs differently, so compare a line against its own record, on the same basis, week after week.
Why efficiency is low
Poor line balancing. One slow operation limits the whole line. Operators upstream build up work in progress and operators downstream wait.
Absenteeism. A missing skilled operator is replaced by a helper or a floater who works slower on that machine, and the balance is lost for the day.
Machine downtime. Breakdowns, needle changes and waiting for a mechanic all use attended minutes while output stops.
Style changeover. Layout change, machine setting and the learning curve cost output, most heavily on short orders.
Input delays. Late cutting, missing trims or panels held at print or embroidery leave the line sitting idle.
Rework. Pieces that come back from the quality table use minutes twice and count as output once.
Set the target efficiency from what the line recently achieved on a similar style, not from 100%.
Why hourly data must be captured on the floor
An efficiency figure worked out at the end of the day from a total written by the supervisor tells you that the line missed target. It does not tell you when or why.
Hourly output shows the pattern. A line that makes 45 pieces in the first hour and 75 after lunch had an input or setting problem. A line that drops at 3 pm had a breakdown or a bottleneck.
Totals rebuilt from memory get smoothed. Bad hours are averaged into good ones and the cause is lost.
Headcount changes during the day. If two operators were lent to another line at noon, the denominator must change at noon.
A supervisor can still act on a problem seen at 11 am. Nothing can be done about one found in next week's report.
The minimum record per line per hour is: style, pieces passed at end of line, operators present, and any lost time with a reason.
Frequently asked questions
Is SMV the same as SAM? In day-to-day factory use, yes. Both mean the standard time for an operation or garment, including allowances. Check which allowances a buyer's figure includes before comparing it with your own.
Should helpers be counted in line efficiency? Decide once and keep to it. Many factories count everyone on the line, operators and helpers, because all of them are paid from the same CM. If you count operators only, the percentage will look higher for the same output.
How do I calculate efficiency when the line runs two styles in a day? Multiply each style's output by its own SMV, add the produced minutes together, and divide by the total attended minutes.
Where Octapus fits
Matrix ERP is our group ERP for vertically integrated garment manufacturers. It covers production, textile, accessories, lab, finance, commercial and HR in one system, so the numbers that go into an efficiency figure are held in one place and not copied between spreadsheets.
Matrix ERP is in beta, and we are taking a small number of early-access groups. If your efficiency reports are still rebuilt by hand at the end of each day, talk to us about what you record on the floor now.
TopicERP